As modern web applications increasingly rely on background processing for tasks like emails, notifications, and data synchronization, BullMQ UI has become one of the go-to libraries in the Node.js ecosystem for handling job queues efficiently. But working with queues doesn’t always mean writing scripts or digging through logs. That’s where the BullMQ UI comes in—providing a visual, interactive interface to monitor, manage, and debug your queues in real time.
This article dives into the purpose, features, and best options available when it comes to using a BullMQ UI—helping both developers and non-technical users gain full visibility into job processing workflows.
? What Is a BullMQ UI?
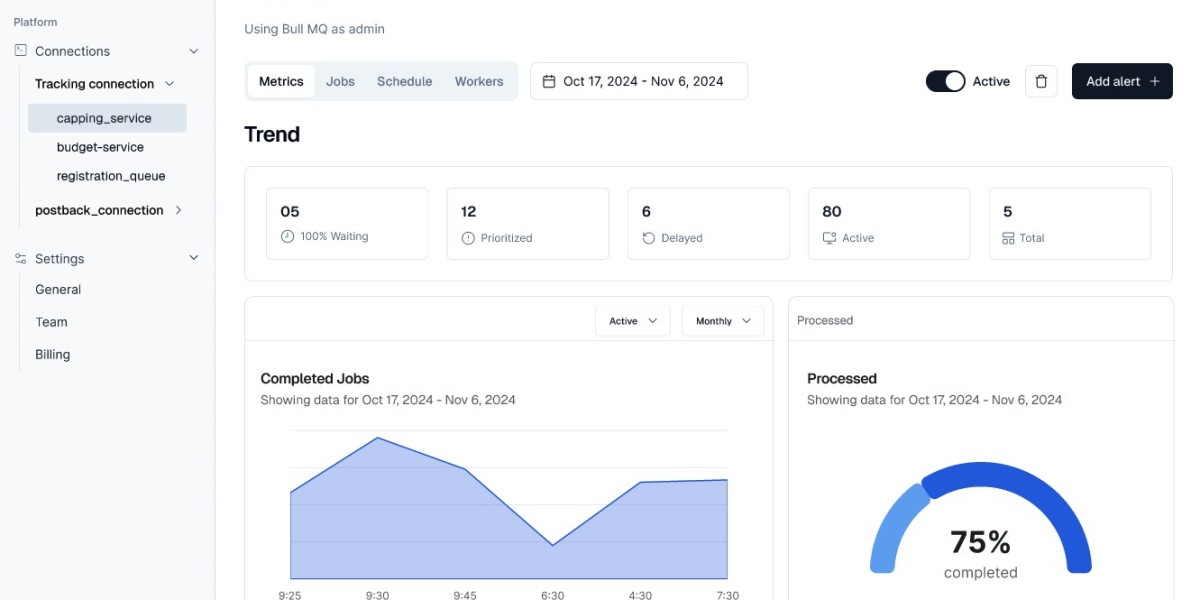
A BullMQ UI is a graphical user interface that connects to your BullMQ queues (which run on Redis) and provides a dashboard-style view of all job activity. It removes the need to use CLI tools or write custom code to check job status, retry failed jobs, or analyze performance.
With the right UI, you can:
View real-time status of all queues
Drill down into individual job details
Retry, delete, or promote jobs
Track processing trends and errors
Detect stuck or delayed queues
? Core Benefits of Using a BullMQ UI
Real-Time Monitoring
Instantly see what jobs are running, waiting, completed, or failed—no need to query Redis manually.Faster Debugging
Identify failed jobs, inspect error messages, and retry or remove jobs directly from the interface.Better Collaboration
Teams beyond developers (QA, product, DevOps) can safely inspect job data without access to code or servers.Increased Transparency
Easily track job flow, monitor queue throughput, and identify bottlenecks or regressions.
? Popular BullMQ UI Tools
✅ Taskforce.sh (Official BullMQ Dashboard)
Taskforce.sh is the official UI created by the maintainers of BullMQ. It offers a full-featured, modern dashboard tailored for production-grade queue management.
Highlights:
Real-time job status for multiple queues
Visual job flow with parent/child relationships
Retry, promote, and delete jobs
Monitor worker and Redis health
Role-based access control for teams
Cloud or self-hosted versions available
Best For:
Teams needing a professional, secure, and full-featured UI for production environments.
✅ BullBoard
BullBoard is a lightweight, open-source UI for Bull and BullMQ. It’s ideal for development environments or internal tools.
Highlights:
Simple and fast to set up
View and manage job states
Integrates easily with Express apps
Limitations:
Minimal visualizations
No historical data or advanced job flow insights
Best For:
Developers and small teams looking for a no-frills interface during development or testing.
✅ Grafana Dashboards (with Metrics Exported)
Though not a UI specifically for BullMQ jobs, Grafana can serve as a custom UI when paired with Prometheus or another metrics exporter. It’s more suited for tracking performance rather than job control.
Highlights:
Visual metrics: job throughput, failures, latency
Set up real-time alerts
Scalable for large systems
Best For:
DevOps teams focusing on performance monitoring and alerting, not job-level management.
? Security and Access Control
If you're using a BullMQ UI in production, especially one like Taskforce.sh, ensure it includes:
Role-based permissions
Audit logs
Secure connections to Redis
Environment segmentation (e.g., dev, staging, prod)
These features help you avoid unauthorized access and maintain data safety across your environments.
? Use Cases for BullMQ UI
QA testing: View and retry test jobs during staging runs
Customer support: Investigate why a notification or background process failed
Product analytics: Track how long jobs are taking in production
Operations: Set up alerts and monitor real-time queue health
Debugging: Drill into stack traces and retry failing jobs directly
? Final Thoughts
A robust BullMQ UI transforms your background job system from a black box into an observable, controllable workflow engine. Whether you're debugging failed tasks, managing high-scale queues, or just gaining insight into asynchronous workloads, using a UI like Taskforce.sh or BullBoard saves time, reduces errors, and empowers your entire team—not just developers.